Pivot tables
Total by region, count by status, sales by month, in a minute and without writing a formula.
What a pivot table does
A pivot table takes a clean table (lesson 1) and summarises it: one row per region with the total for each, one row per product with the count of orders, months across the top and categories down the side. It rebuilds itself when the data changes, and it never touches the original rows.
If you are about to write ten SUMIF formulas, one for each region, a pivot table does the same job faster and will not miss the region you forgot.
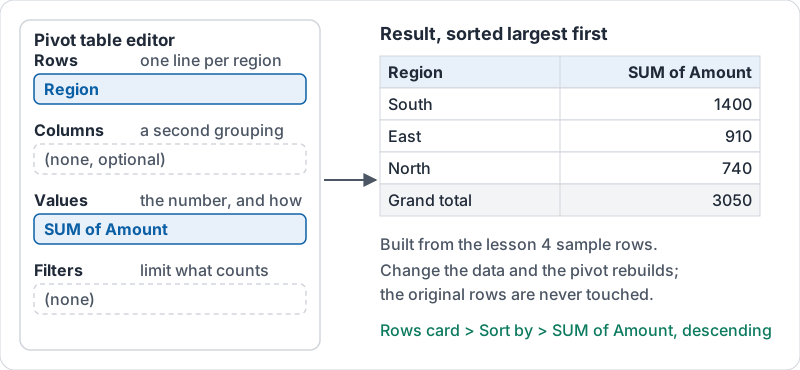
The four boxes
| Box | Put here | Example |
|---|---|---|
| Rows | The thing you want one line per | Region, Rep, Product |
| Columns | A second grouping across the top (optional) | Month, Status |
| Values | The number to summarise, and how | SUM of Amount, COUNT of Order |
| Filters | Limit what is included | Only Status = Paid |
Start simple: one field in Rows, one in Values. Add Columns only when a two-way table genuinely answers the question.
The four boxes and the table they produce from the lesson 4 sample rows.
SUM, COUNT or AVERAGE
The Values box asks how to summarise. Pick deliberately:
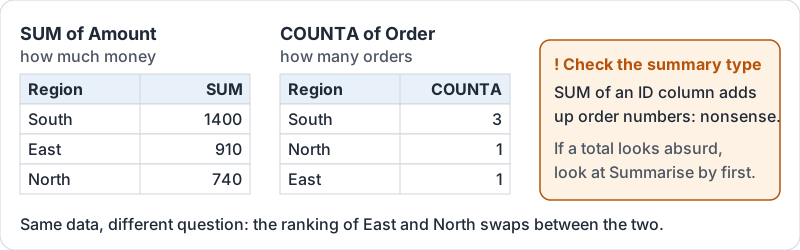
- SUM of Amount: how much money per region.
- COUNTA of Order (or any text column): how many orders per region.
- AVERAGE of Amount: typical order size per region.
A pivot that shows SUM of Order numbers is meaningless; it added up the IDs. If a total looks absurd, check the summary type.
Same data, two summary types, two different rankings.
Grouping dates by month
A Date column gives one row per day, which is rarely what you want. Group the dates by month or quarter inside the pivot and the rows collapse to “Jan, Feb, Mar”. This only works if the dates are real dates (lesson 1).
Sorting and reading it
Sort the pivot by the Values column, largest first, and the biggest region is on top. The smallest or the biggest drop is then obvious. Put two months in Columns and the comparison sits side by side.
Pivot tables do not update instantly in every case; if the data changed and the pivot looks stale, refresh it or check that the source range still covers all the rows (use whole columns in the source range to avoid this).
Try it now
On a sales sheet, insert a pivot table on a new sheet with Region in Rows and SUM of Amount in Values. Sort it largest first. Then change the Values summary to COUNTA to see the number of orders per region and notice how different the ranking is.
Remember: Rows is what you want one line per, Values is the number and how to summarise it. Check SUM versus COUNT before you trust a total.
Checking your progress…